
Price & Time: Sell in May?
Talking Points
Other indices key for SPX going forward
EUR/USD holds key support
Second half of April important for Aussie
New to Currency Trading? Learn More HERE
Foreign Exchange Price & Time at a Glance:
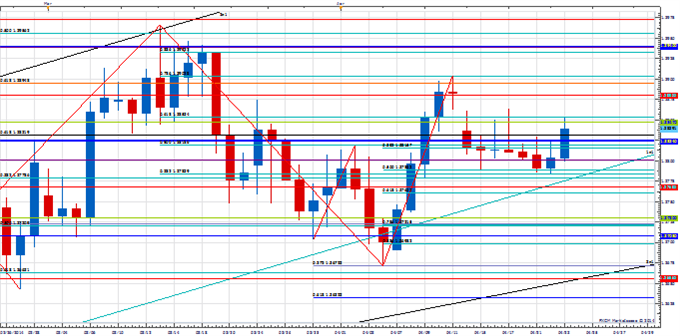
Price & Time Analysis: EUR/USD
Charts Created using Marketscope – Prepared by Kristian Kerr
EUR/USD remains in a sideways to lower range since failing earlier in the month at the 78.6% retracement of the March to April decline in the 1.3900 area
Our near-term trend bias is positive in the Euro while over 1.3730
A break of 1.3900 is required to signal that a new move higher is underway
A minor cycle turn window is seen on Thursday
Only weakness below the 2nd square root relationship of the year’s high at 1.3730 would turn us negative on the Euro
EUR/USD Strategy: Like the long side while over 1.3730.
Instrument | Support 2 | Support 1 | Spot | Resistance 1 | Resistance 2 |
EUR/USD | *1.3730 | 1.3760 | 1.3840 | *1.3900 | 1.3930 |
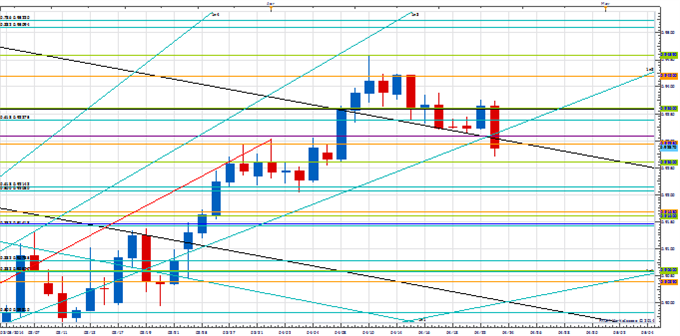
Price & Time Analysis: AUD/USD
Charts Created using Marketscope – Prepared by Kristian Kerr
AUD/USD has come under steady pressure since failing at the 8th square root relationship of the year’s low in the .9495 area earlier in the month
Our near-term trend bias is higher while above the 2nd square root relationship of the year’s high at .9265
Interim resistance is eyed around .9360, but over .9495 is really needed to confirm the start of any new important push higher
A minor cycle turn window is seen today, the second half of April is a broader turn window
A move under .9265 would turn us negative on the exchange rate
AUD/USD Strategy: Like being square for a few days.
Instrument | Support 2 | Support 1 | Spot | Resistance 1 | Resistance 2 |
AUD/USD | *1.0910 | .9265 | .9285 | .9360 | *.9495 |
Focus Chart of the Day: S&P 500

The price action in the S&P 500 since March has taken very much by surprise. Both extremes of the March range had important timing associated with them. Both extremes were broken in the first half April and both had almost no follow through. Frustrating, but oftentimes part of the game in a low vol regime. The key going forward looks to be the Dow on the downside and the NDX on the upside. We say this because the Dow has been relatively strong over the past few weeks and never breached its March 17th low. If weakness materializes in the weeks ahead and extends into the stronger Dow and sees it move below 15,980 then this would be a very powerful sign that a top of some importance is developing. The opposite can be said of the NDX. It has been the weakest of the main indices and its March high is still firmly intact. If a new leg higher is developing we will want to see strength extend into the weaker issues to confirm. A move through 3,740 in the NDX would be very bullish. A few medium-term cyclical relationships converge around the start of May, but mid-July is still the key cyclical focal point.
To receive Kristian’s analysis directly via email, please SIGN UP HERE.
--- Written by Kristian Kerr, Senior Currency Strategist for DailyFX.com
This publication attempts to further explore the concept that mass movements of human psychology, as represented by the financial markets, are subject to the mathematical laws of nature and through the use of various geometric, arithmetic, statistical and cyclical techniques a better understanding of markets and their corresponding movements can be achieved.
To contact Kristian, e-mail kkerr@fxcm.com. Follow me on Twitter @KKerrFX
DailyFX provides forex news and technical analysis on the trends that influence the global currency markets.
Learn forex trading with a free practice account and trading charts from FXCM.
